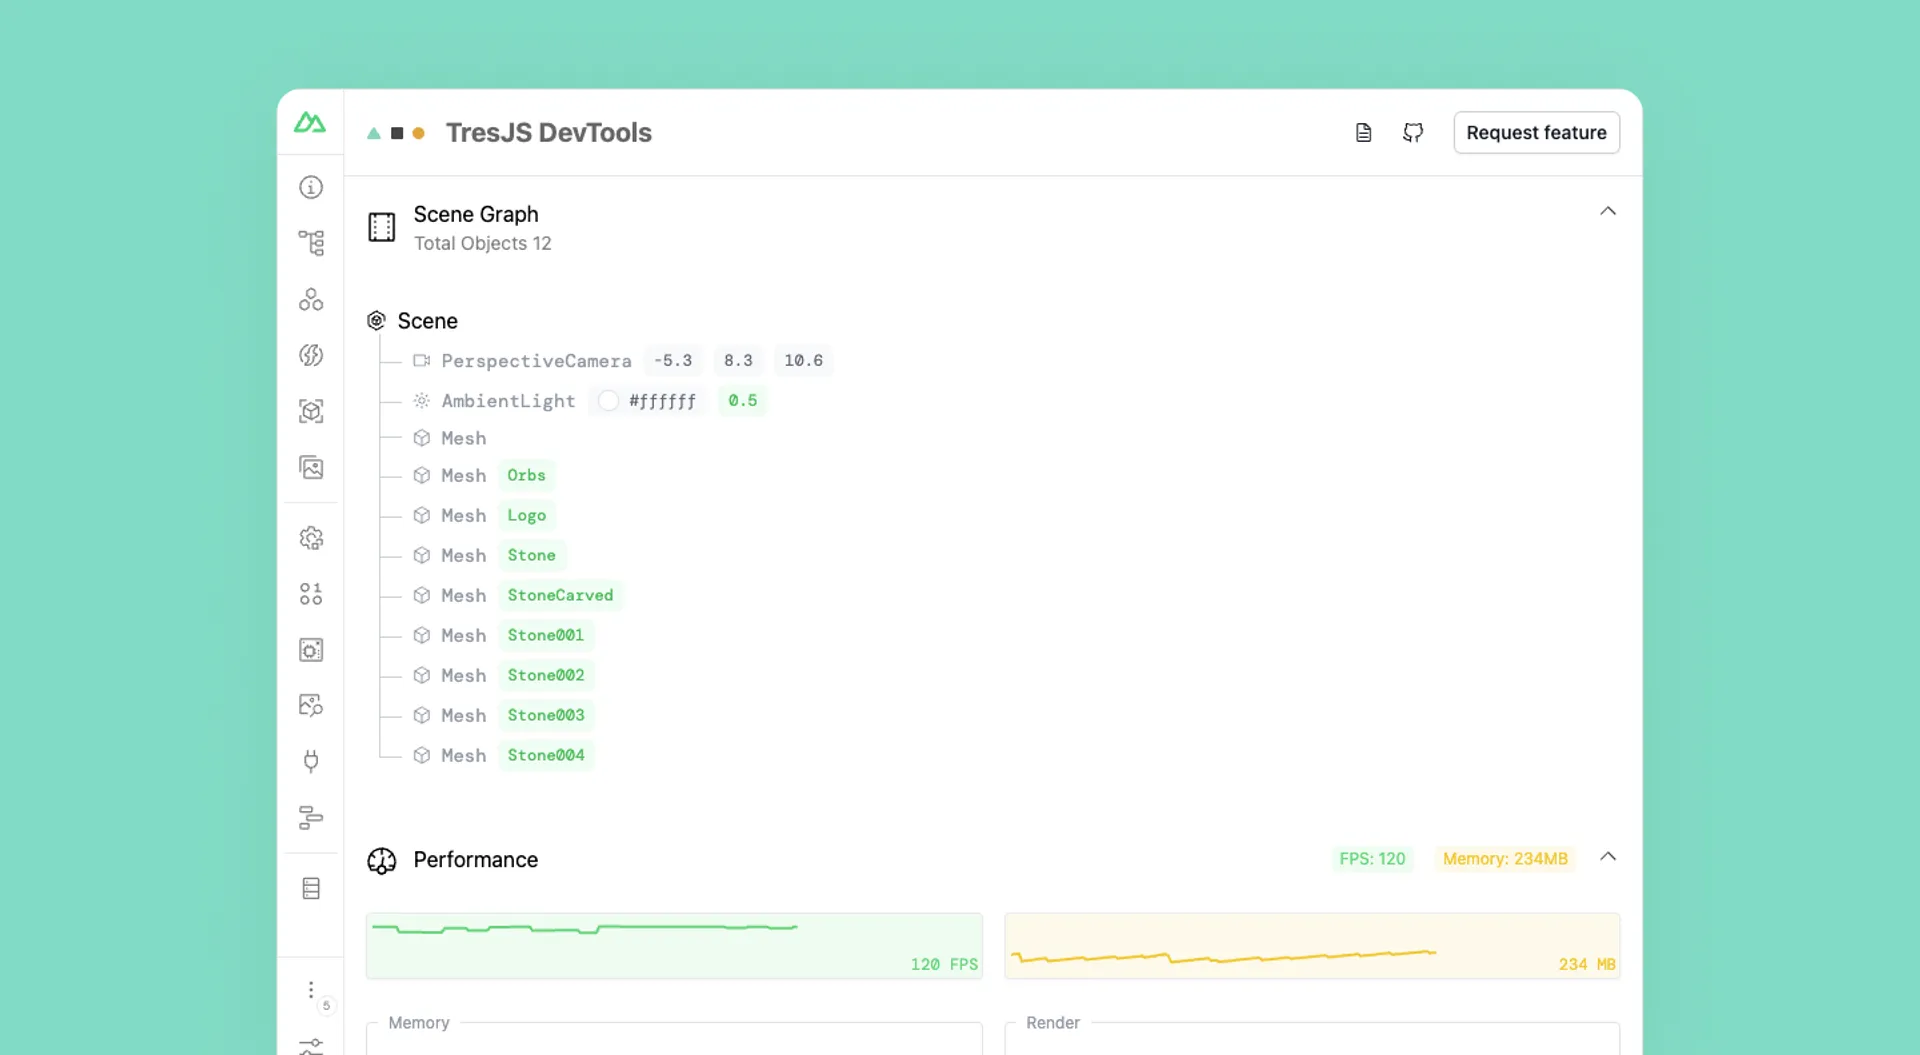
Presenting TresJS Nuxt Devtools
The 3D ecosystem on the web have been always pretty tricky to debug. The lack of tools and the complexity of topics like memory management makes it hard to understand what is going on sometimes.
Since the beginning of TresJS, our focus has been to provide the best developer experience possible. We are grateful to be on a time where more and more libraries are emerging to provide better DX to developers. In this article, we will talk about how we are using Nuxt Devtools to improve the DX of TresJS.
This feature is part of the v2.0.0 release of @tresjs/nuxt module.
Usage
export default defineNuxtConfig({
  modules: ['@tresjs/nuxt', '@nuxt/devtools' ],
  tres: {
    devtools: true,
  },
})
What is Nuxt Devtools?
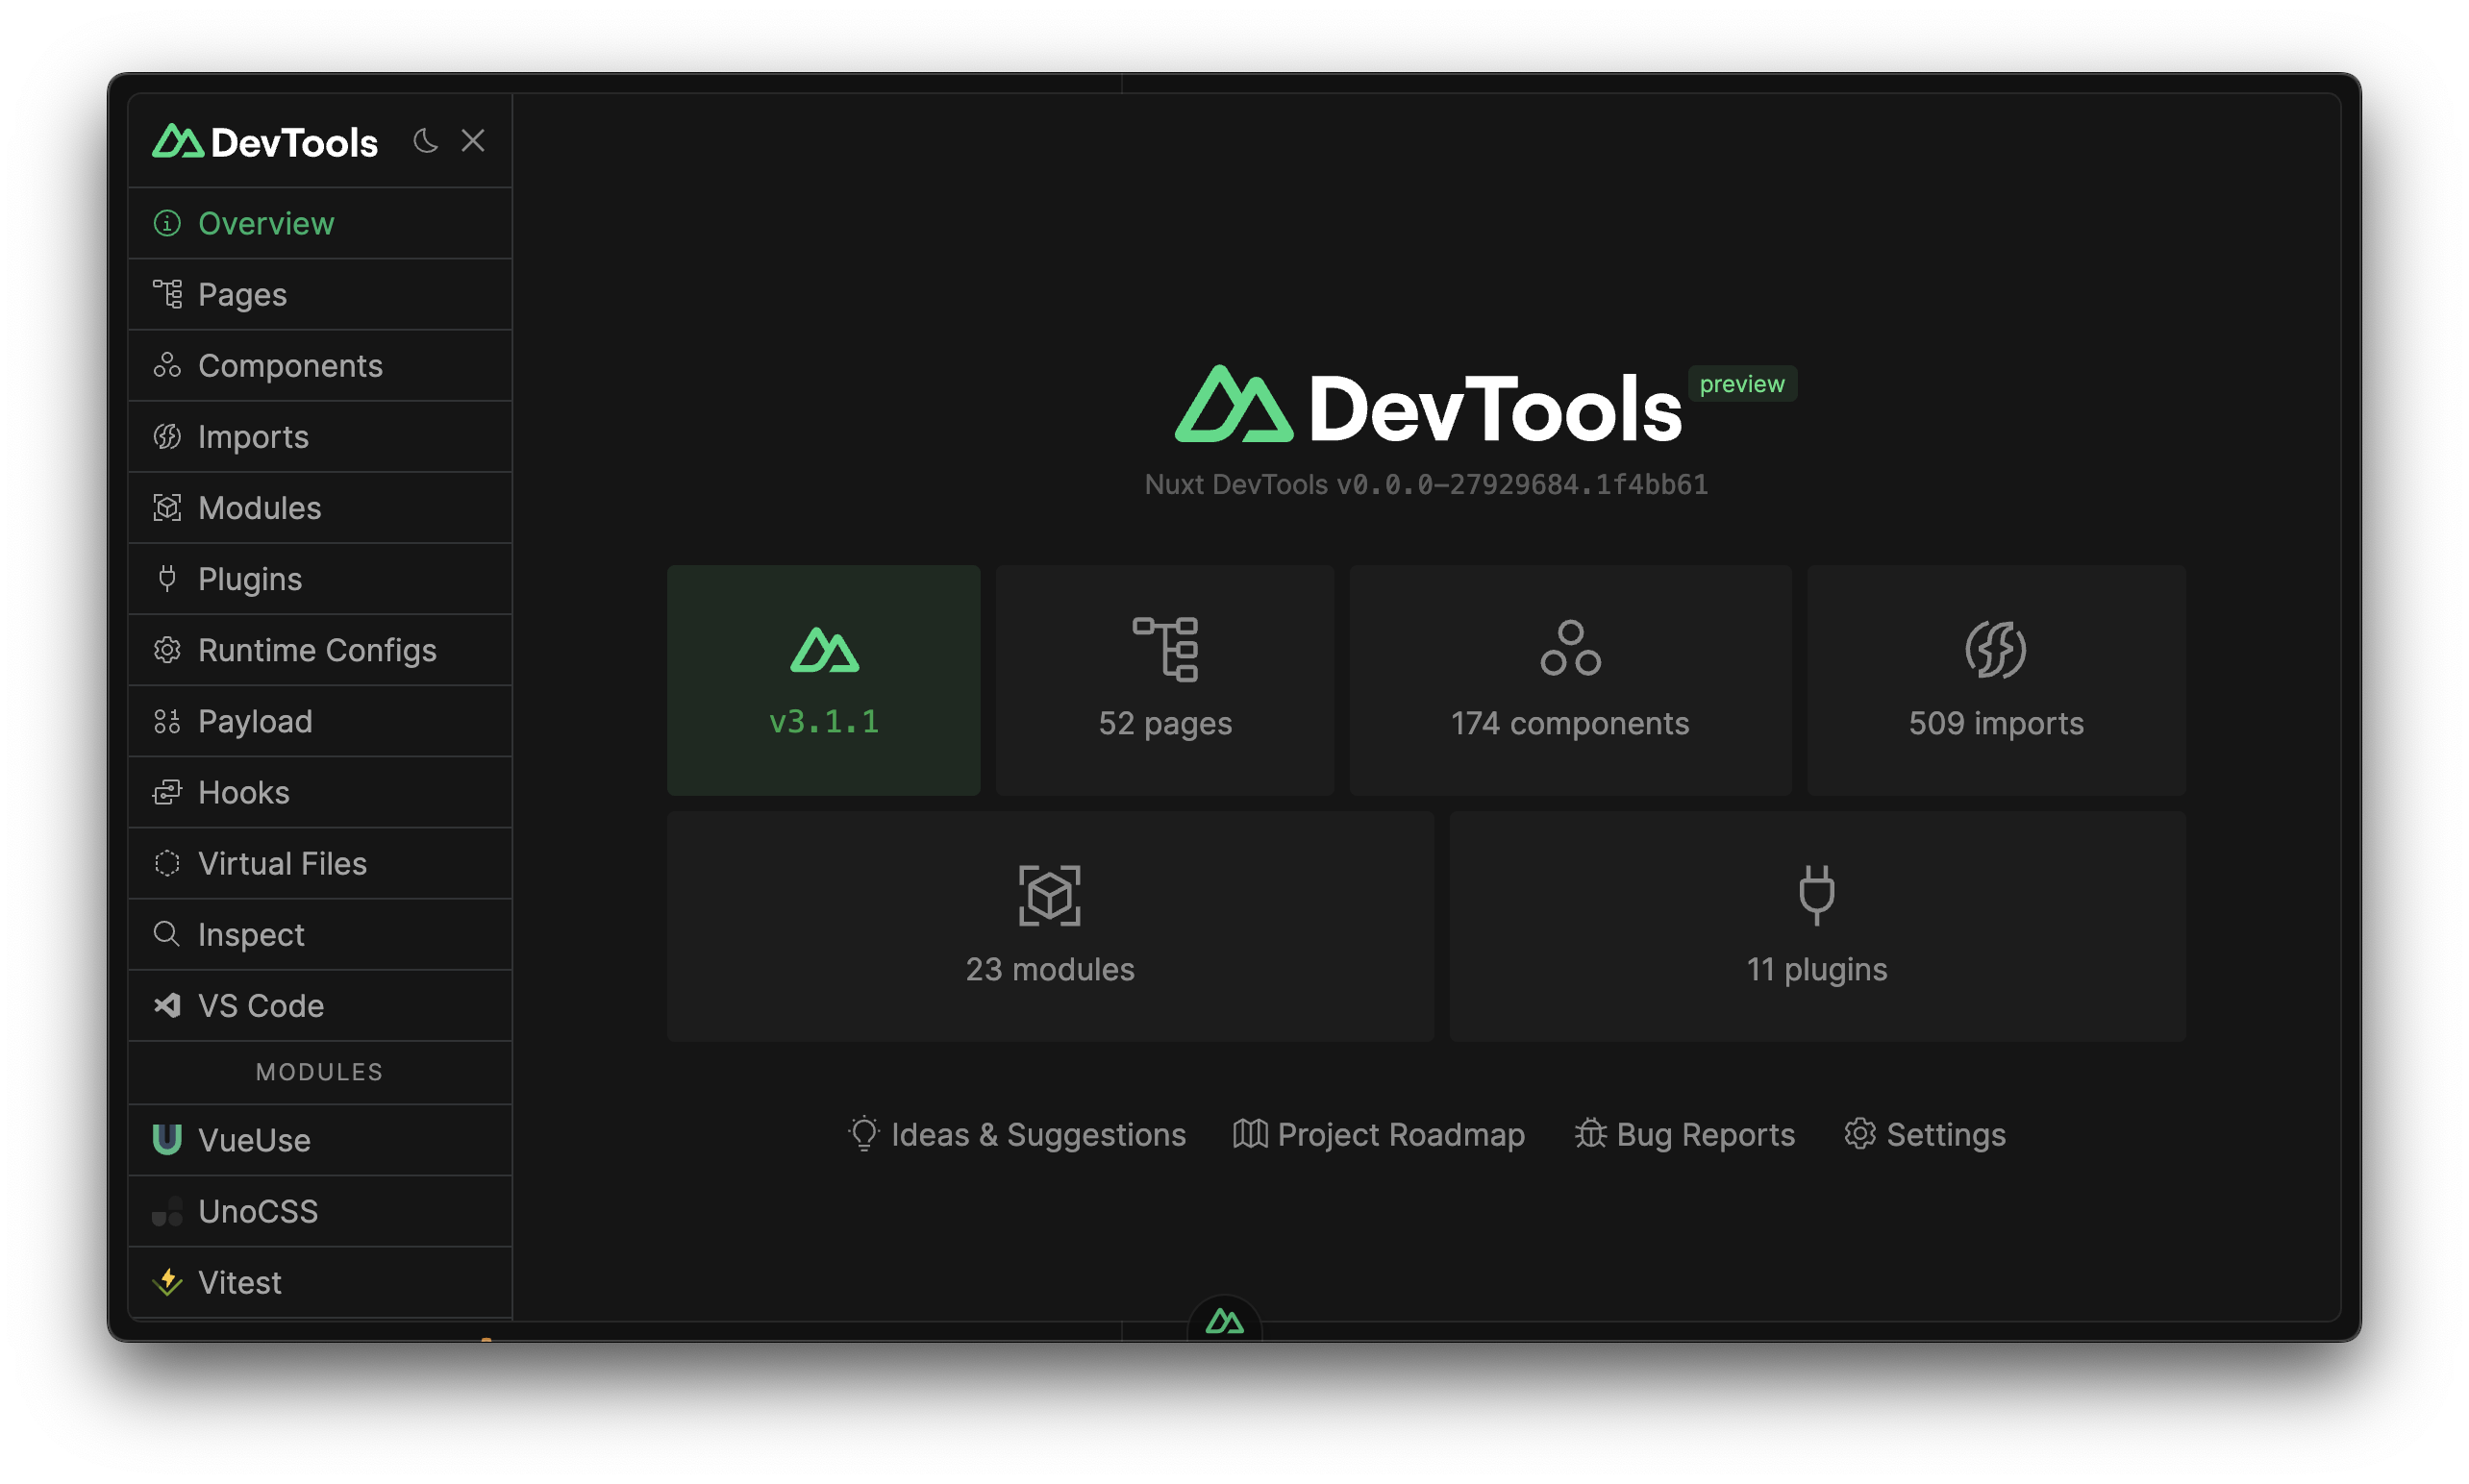
Nuxt Devtools is a module with a new layer of tools that helps you to inspect and debug your Nuxt application.
// nuxt.config.ts
export default defineNuxtConfig({
  modules: [
    '@nuxt/devtools',
  ],
})
Provides usefull info about your Nuxt app like:
- imports: List of all the imports of your app
- pages: shows your current routes with some useful information
- components: List of all the components of your app
- modules
- assets
and the list go on with infinite usefull resources! https://devtools.nuxt.com/guide/
How we are using it?
We wanted to bring the same DX to TresJS without developing a new tool from scratch. Thankfully Nuxt Devtools has a module API that allow us to create our own tabs and panels.
import { addCustomTab } from '@nuxt/devtools-kit'

addCustomTab({
  // unique identifier
  name: 'tres-nuxt-devtools',
  // title to display in the tab
  title: 'TresJS',
  // any icon from Iconify, or a URL to an image
  icon: 'https://raw.githubusercontent.com/Tresjs/tres/main/public/favicon.svg',
  // iframe view
  view: {
    type: 'iframe',
    src: DEVTOOLS_UI_ROUTE,
  },
})
This is how it looks like:
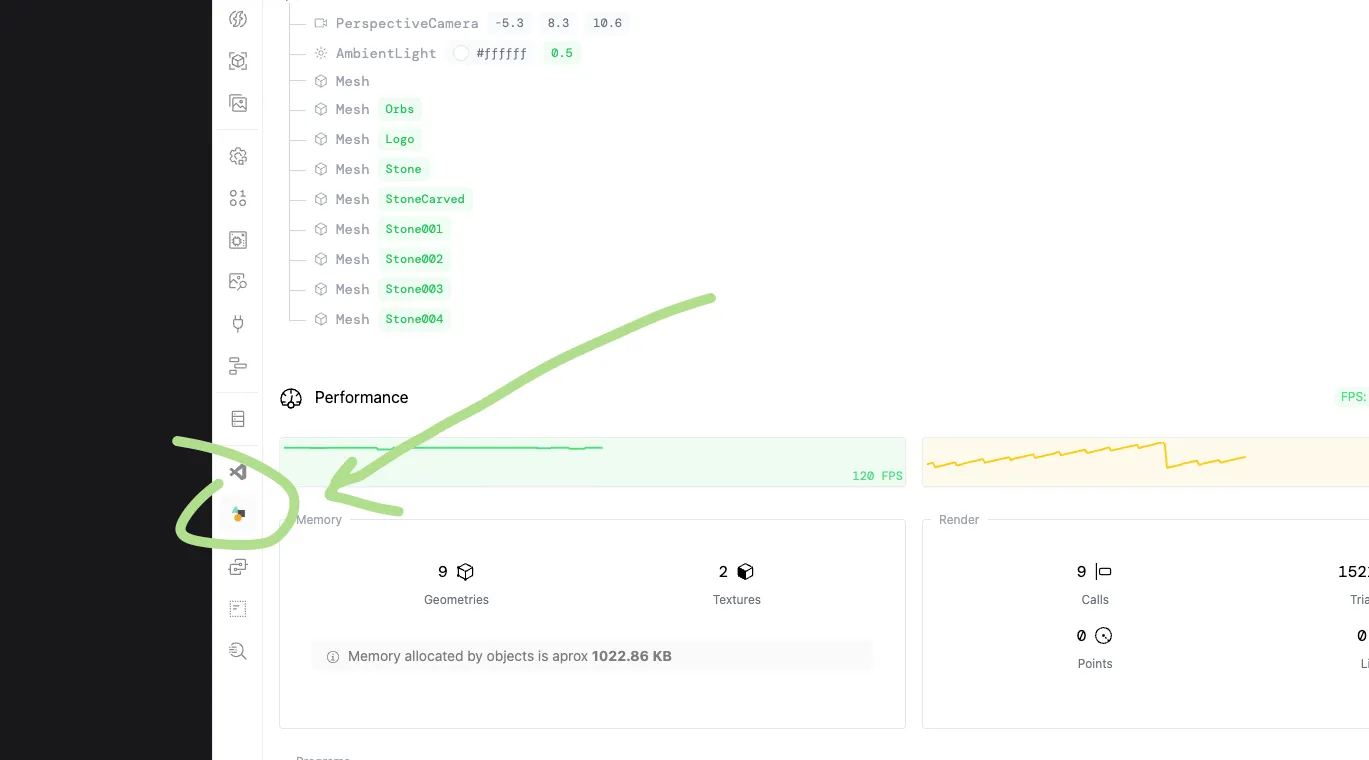
Features
Scene graph
How many times you wanted to debug if an object has been added to the scene or check the position of the camera? Unlike the DOM, the 3D scene is not visible in the browser inspector and it is hard to debug.
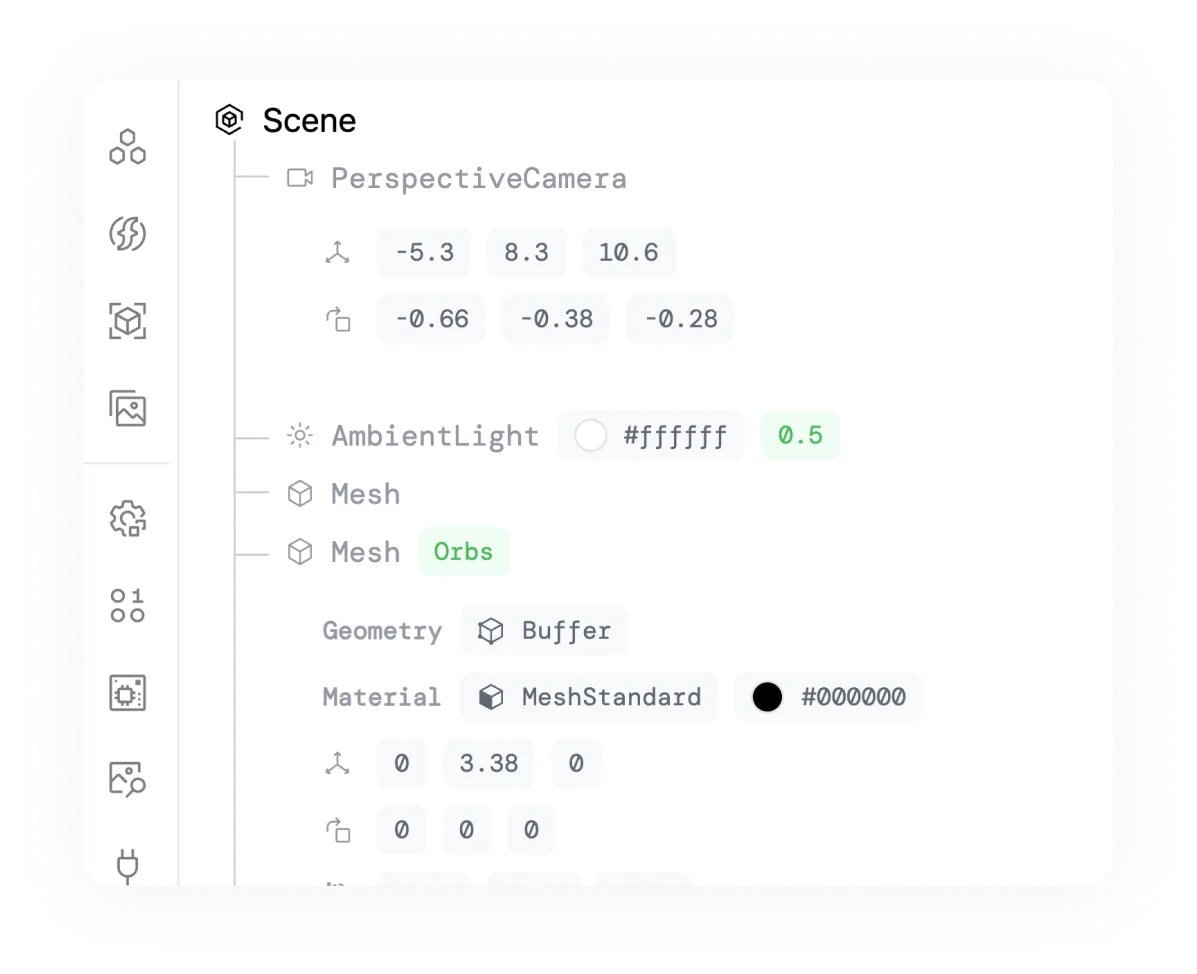
You will find usefull information about the objects like:
- position
- rotation
- scale
- color (applicable to materials, lights)
- intensity (applicable to lights)
If you would like us to include more information or you find a bug, please let us know in the Discord channel or open an feature request in the repo here
Performance
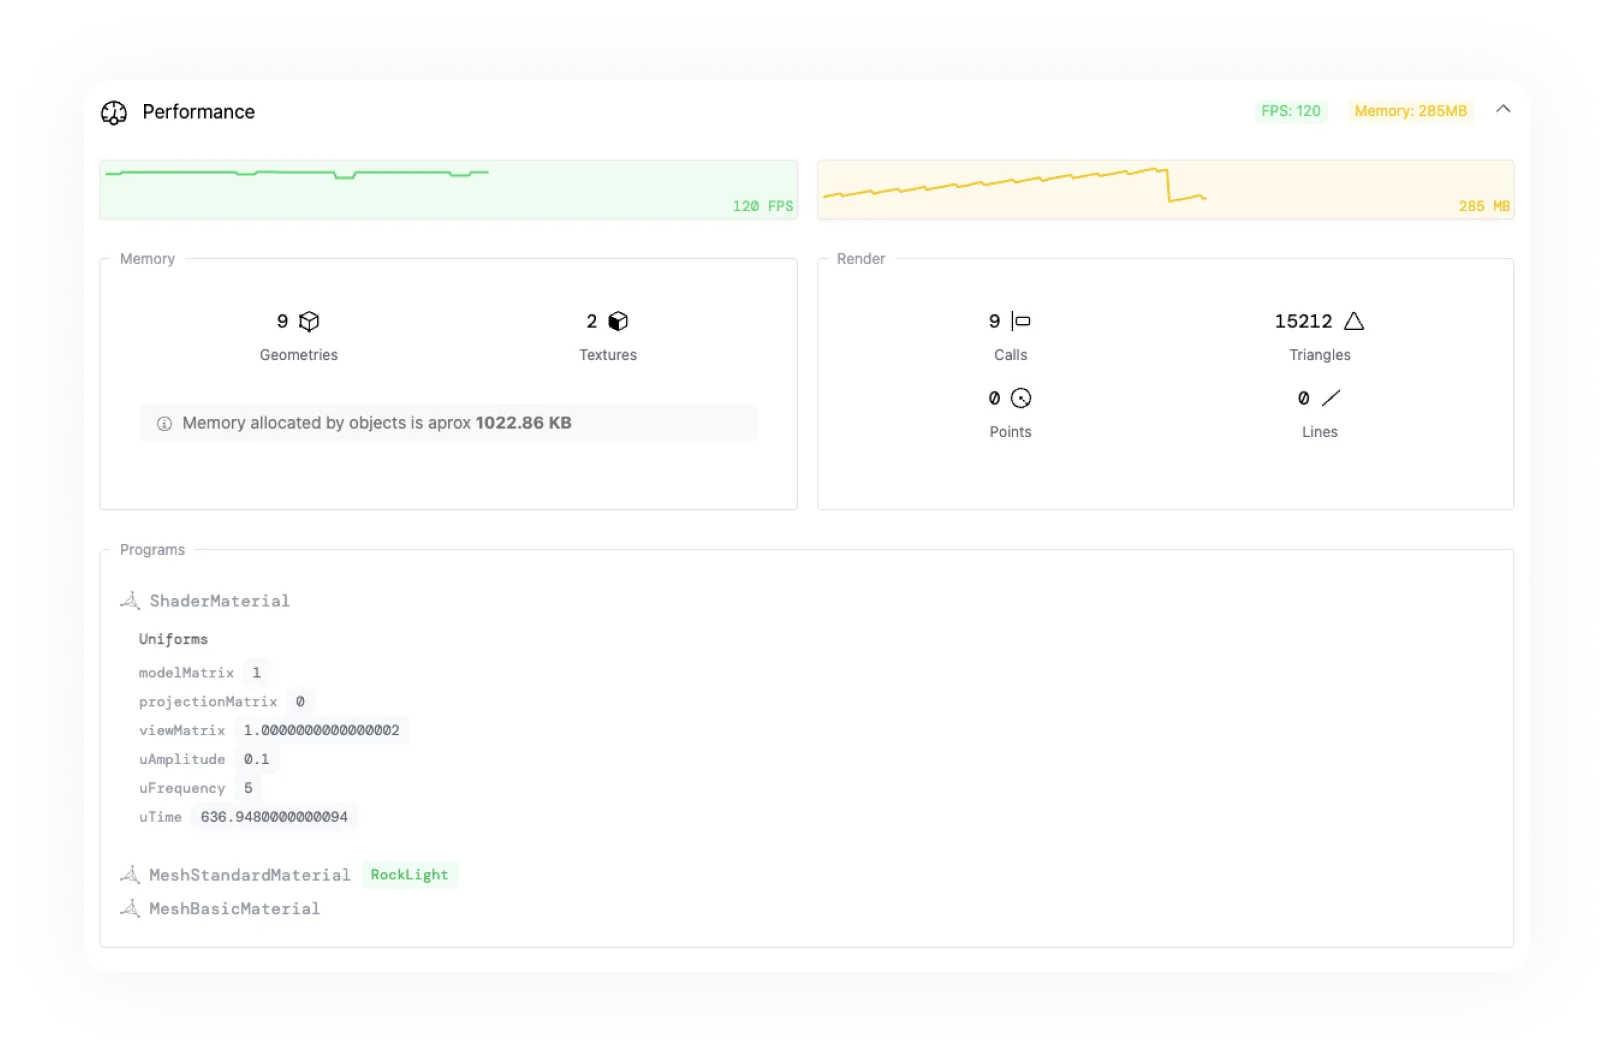
The performance tab shows the current FPS and memory usage of your app. It also shows the current number of objects in the scene and the number of geometries and textures that are being rendered via renderer.info.memory and the amount of calls, triangles, points and lines via renderer.info.render.
It also provides helpful information about the shader programs that are being used in the scene, providing values like the uniforms and attributes.
Shaders support
Apart from the devtools, the version 2.0.0 of @tresjs/nuxt module also a vite plugin that allows you to import GLSL shaders as strings. It uses vite-plugin-glsl under the hood and its optional.
export default defineNuxtConfig({
  modules: ['@tresjs/nuxt', '@nuxt/devtools' ],
  tres: {
    glsl: true,
  },
})
With this option enabled, you can import GLSL shaders as strings in your components.
<script setup lang="ts">
import vertexShader from './shaders/vertex.glsl'
import fragmentShader from './shaders/fragment.glsl'

const uniforms = {
  uTime: { value: 0 },
  uAmplitude: { value: new Vector2(0.1, 0.1) },
  uFrequency: { value: new Vector2(20, 5) },
}
</script>

<template>
  <TresMesh
    :position="[0, 4, 0]"
  >
    <TresSphereGeometry :args="[2, 32, 32]" />
    <TresShaderMaterial
      :vertex-shader="vertexShader"
      :fragment-shader="fragmentShader"
      :uniforms="uniforms"
    />
  </TresMesh>
</template>
Future
We are planning to add more features to the devtools like:
- GPU profiler
- CPU profiler
- 3D Model previsualization (GLTF, GLB, OBJ, FBX, etc)
We also considering creating a integration for the vite-plugin-vue-devtools when the API is available 😊.
If you would like to contribute to the project, please let us know in the Discord channel.
Thanks for reading!
Get started with TresJS and Nuxt
pnpm add three @tresjs/nuxt